Why Structured Data and Definitions Vastly Outperform Unstructured PDFs in LLM Analysis

This article by XBRL International Guidance Manager Revathy Ramanan is based on her presentation at Data Amplified 2024. You can also watch the original video here.
Large language models like ChatGPT are fascinating. They’re transforming how we understand and interact with data – and I’ve been particularly curious to explore how we can use LLMs to analyse XBRL data.
In previous blogs, I shared some of my initial experiments using ChatGPT to analyse XBRL reports. In this article, I investigate the utility of providing metadata defined in the taxonomy for better analysis.
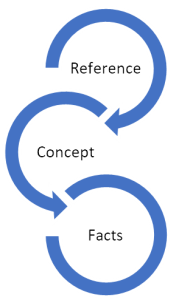
In an XBRL report, each fact is tagged with a reporting concept and associated metadata, such as the reporting period and unit of measure. The taxonomy defines additional “metadata on the metadata” for the reporting concepts, including concept definitions, references to the underlying standards, and relationships with other concepts. This taxonomy metadata enhances the contextual richness of the facts in the report and providing AI with a deeper understanding of the information.
Over a range of experiments, I have found that combining structured data with taxonomy metadata enables more accurate and insightful analysis than can be achieved by relying on unstructured data like PDFs.
Gross Profit Analysis: Uncovering Variations
Gross profit is typically calculated as revenue minus cost of sales. Some issuers, however, vary this basic approach. This analysis looks at different ways in which companies are calculating gross profit.
I looked at gross profit calculations from 350 ESEF reports, including extended taxonomies. For each report, I extracted the calculation relationships in JSON format using the XBRL taxonomy model embedded in the Inline XBRL Viewer found on filings.xbrl.org.
This method offers one way of obtaining taxonomy relationships for use in LLMs, without actually supplying complete taxonomy information directly where this is complex. The ongoing OIM taxonomy effort aims to standardise access to taxonomy information in future, making it easily usable in a simplified and modern format.
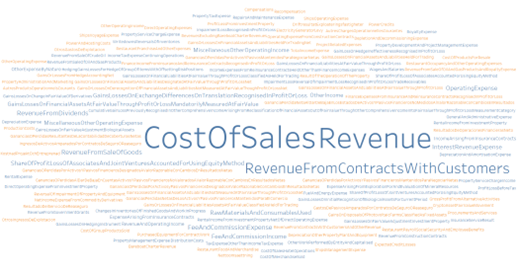
With a request to ChatGPT, I found that there were 62 different methods of calculating gross profit. The components of these calculations are displayed in the following word cloud.
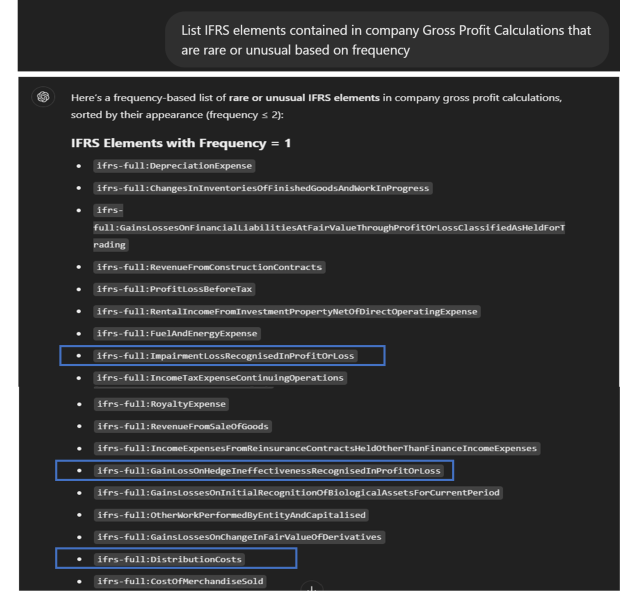
As you would expect, revenue and cost of sales are by far the commonest components in calculating gross profit. Many unusual elements also appear, both from the base taxonomy and from extensions, and seem interesting for further analysis. These include some rare IFRS elements.
Items like ‘distribution costs’ and ‘impairments’ aren’t unusual in income statements. What stands out is their inclusion in gross profit calculations, which is less common – and one might want to examine those reports more closely.
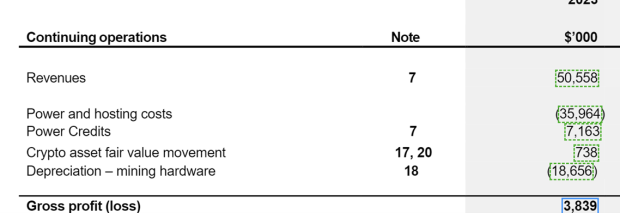
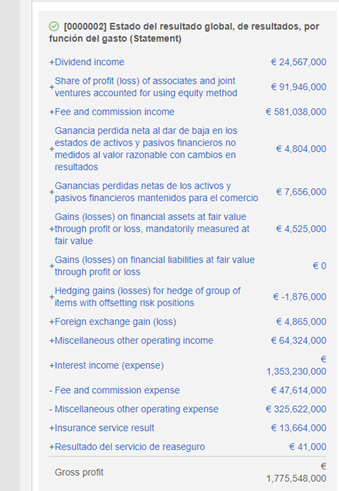
Let’s look at some examples of reports using unusual components in gross profit calculations.
The company above included an impairment loss in its calculation.
This one used crypto asset valuation in calculating gross profit.
Above is an extract from a bank report whose gross profit calculation involved multiple components, likely due to tagging errors.
These examples highlight how taxonomy relationships can help identify unusual practices or potential errors in disclosures.
In contrast, let’s look at extracting profit calculation from a PDF report using ChatGPT.
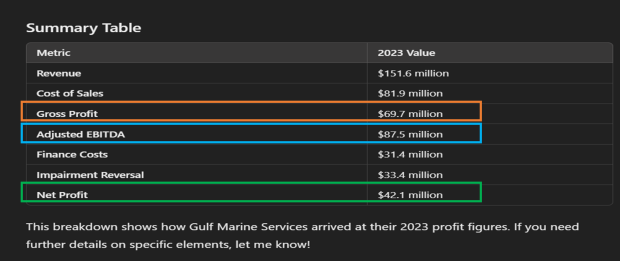
Here, I uploaded a single annual report in PDF format to ChatGPT and it asked to list the components used in the gross profit calculation. GPT returned an answer based on general knowledge.
In a further step, I asked for a breakdown of net profit calculations.
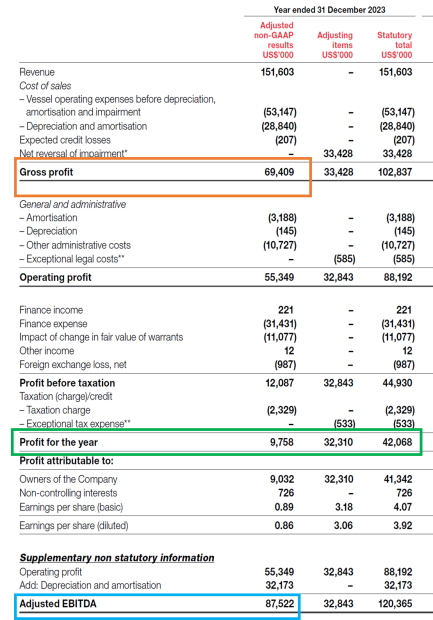
ChatGPT erroneously included non-GAAP measures and values in its list of metrics used in the net profit calculation, which were in fact present in another section of the report. The selected values also do not mathematically add up to net profit.
Following is an extract from non-GAAP reconciliation; we can see the metrics and values that ChatGPT has incorrectly selected from this table as part of the profit calculation.
This demonstrates how structured data,and taxonomy metadata provide a more reliable approach than extracting data relationships from unstructured formats.
Leveraging Taxonomy References
Taxonomy references can be incredibly powerful in extracting specific data points, especially compared to traditional methods like PDFs. Let’s dive into how they work and why they’re so effective.
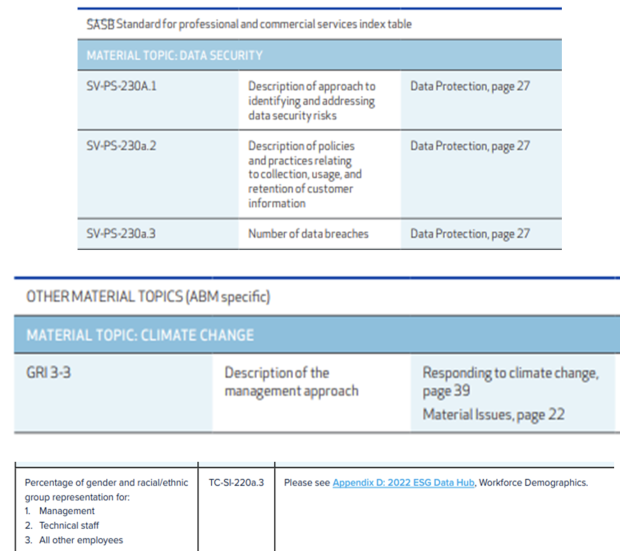
When analysing sustainability reports in PDF format, disclosures are often linked to metrics through broad indexes like the one below. While these indexes help guide human readers or tools like GPT to the right section, they don’t always lead directly to the exact fact.
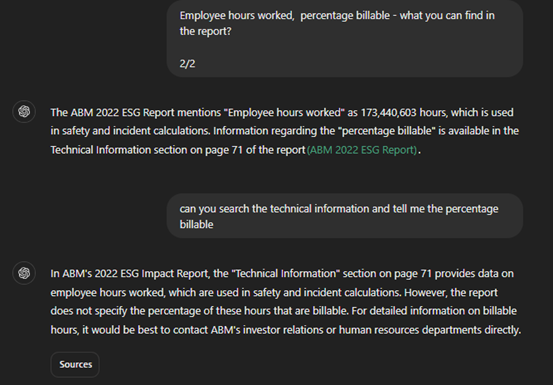
In one report, I searched for the metric “Employee hours worked, percentage billable.” The index pointed me to page 71, and GPT successfully retrieved the total employee hours. However, when asked about the percentage billable, GPT clarified that this detail was not explicitly mentioned in the report.
Another instance:
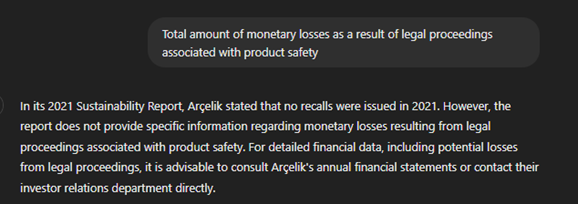
Searching for “monetary losses from legal proceedings related to product safety” in a PDF report showed a similar issue. Even though the index listed this metric, the data was missing or too broadly referenced.
These examples highlight how broadly constructed indexes in unstructured formats like PDFs may be misleading and often fail to provide the precise data needed for analysis.
Let’s do a similar search using taxonomy references.
XBRL reports, particularly when paired with taxonomy references, offer a more efficient and accurate approach. In sustainability taxonomies, reporting concepts specify identifiers for each metric from the underlying standard as references. Supplying ChatGPT with the relevant taxonomy enables it to correctly interpret the metadata references associated with each fact in an XBRL report, and so identify and analyse facts more accurately.
Following is an example of a reference attached to an ESRS reporting concept.
By searching for a specific reference or metric, we can reliably access the fact directly linked to the relevant reporting concept defined in the taxonomy. This is straightforward, as the facts are connected to the concept’s metadata.
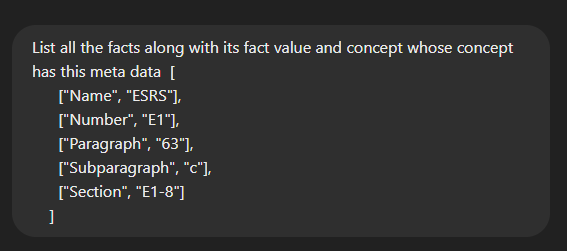
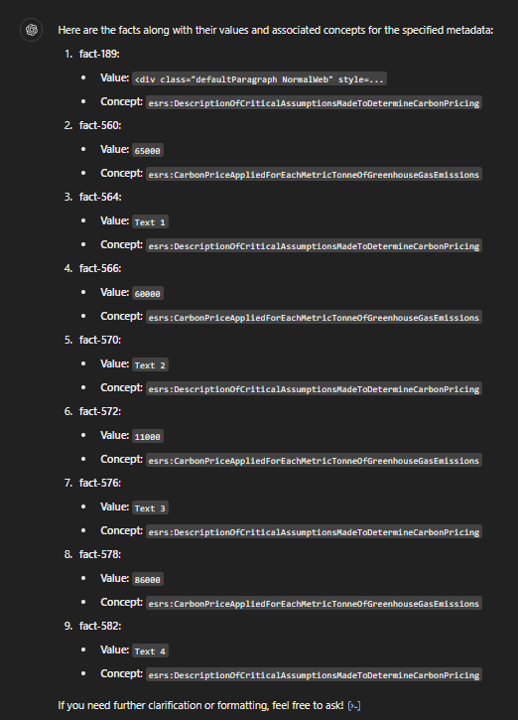
Using the ESRS taxonomy and a sample XBRL report, I asked ChatGPT to locate facts disclosed as per the requirements in paragraph 63, sub-paragraph C. The facts and taxonomy relationships embedded in the sample reports’ Inline XBRL viewer, present in JSON format, were provided as input to ChatGPT.
The response included facts carrying metadata linking them to the requested specific reporting concepts, ensuring accurate and reliable results.
All facts in XBRL are directly connected required metadata, so searching for a reference or metric reliably pulls the associated fact without ambiguity.
This comparison underscores why structured data backed by taxonomy references is much more reliable for analysis:
- Precision: disclosures are linked directly to precise metrics, eliminating guesswork.
- Reliability: data is tied to standards, ensuring consistency.
- Efficiency: this approach reduces time spent searching and interpreting data compared to broad PDF indexes.
By leveraging taxonomy references, we can extract data with far greater accuracy and context than traditional PDF-based methods. This structured approach is a clear step forward for anyone working with sustainability reports or similar disclosures.
Targeted input for analysis
In a previous blog, I explored how ChatGPT can assess the objectivity of narrative sustainability disclosures using text analysis. The structured nature of XBRL data provided clear, focused insights.
This time I conducted a similar assessment on a single PDF report.
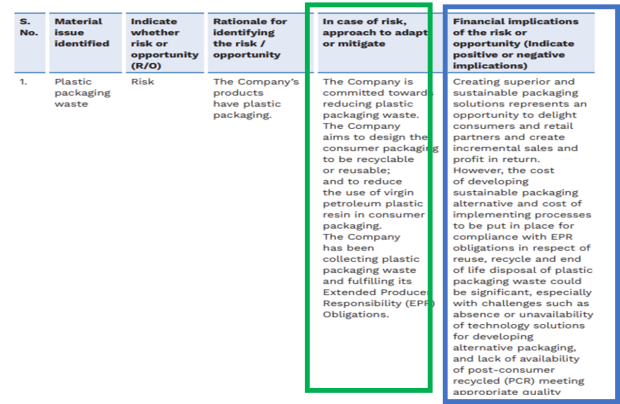
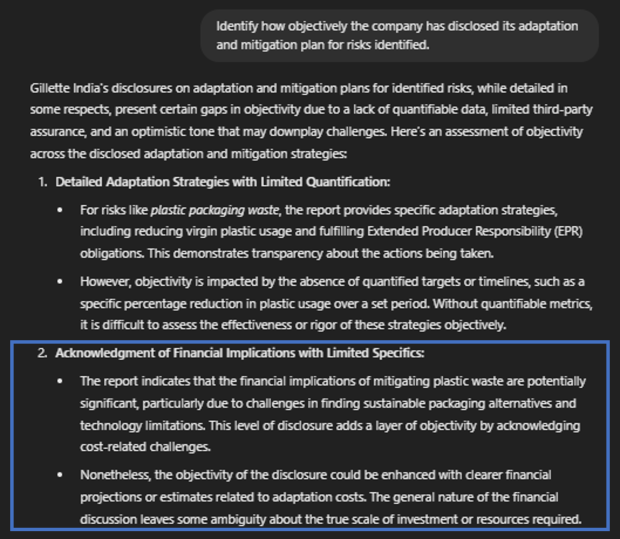
The following is an extract of an Indian sustainability report in PDF format. The query to ChatGPT asked it to assess the objectivity of the company’s adaption and mitigation plan, highlighted with a green box.
While ChatGPT executed the query correctly to an extent, providing an appropriate response in the first part of its answer, it also included conclusions drawn from adjacent sections highlighted in blue, making it harder to isolate and identify the correct information.
This demonstrates one of the key challenges of working with PDF reports is that unrelated content can influence query results, impacting clarity and precision.
As demonstrated in my previous blog analysing sustainability narrative disclosures, we know that when structured XBRL data with targeted inputs is used, the accuracy and relevance of the output are significantly enhanced, showcasing the value of structured data for such analyses.
Key Takeaways: Why Structured Data is better
When it comes to analysing disclosures and extracting meaningful insights, structured data wins, particularly when we provide taxonomies too—and here’s why:
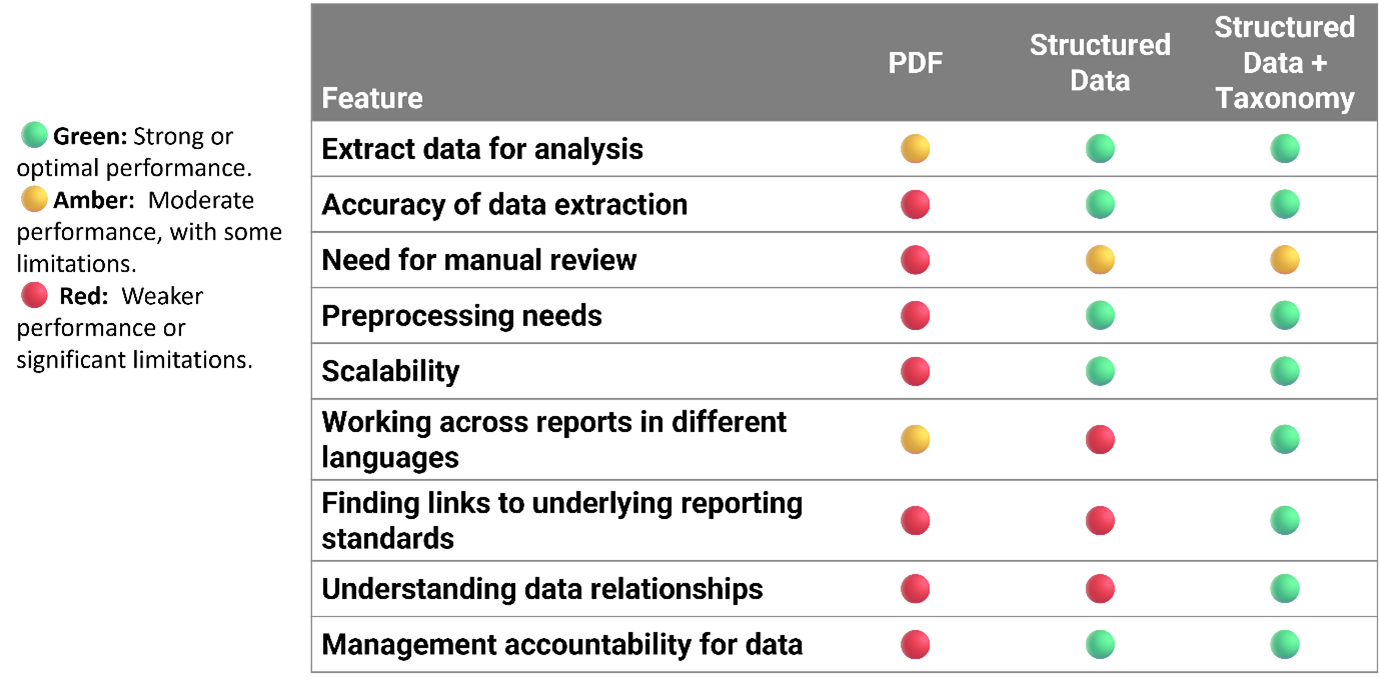
Providing LLMs with both structured data (in the form of XBRL reports) and the relevant taxonomy (used to create those reports) gives them the definitions and relationships it needs to interpret the metadata – in other words, to read the XBRL tags correctly. This significantly improves the depth, accuracy, and reliability of analyses. It provides clear links to concepts and standards, ensuring that insights are well-grounded and trustworthy.
While PDFs are widely used, they fall short in data analysis due to several drawbacks:
- Lower accuracy: extracting information is less precise.
- Manual effort: preprocessing and manual review are needed to ensure relevance.
- Disconnected: PDFs lack clear links to reporting standards.
- Shallow insights: visibility into data relationships is limited.
Most importantly, XBRL data from the regulatory environment offers a definitive statement of fact, bearing the company’s judgment and management accountability. On the other hand, analysis of PDFs often involves interpretive guesswork.
Tools like xBRL-JSON and the ongoing OIM taxonomy effort aim to make structured data more straightforward to use with LLMs, accelerating its adoption in AI analysis.
Regulators, software vendors and accountants have an unprecedented and exciting opportunity to leverage the power of LLMs in combination with structured XBRL data and accompanying taxonomies – maximising the reach and power of analytics to provide insights on performance, identify anomalies, and highlight emerging risks. At the same time, AI tools look set to enhance disclosure quality and consistency, offering the vision of a virtuous cycle of high-value data and powerful analytics.


